Get the data sets from here: https://github.com/rfordatascience/tidytuesday/blob/master/data/2021/2021-09-28/readme.md
Get the updates about this visualization and full code from here: https://github.com/ashgreat/tidytuesday/tree/main/2021-10-01-NBER
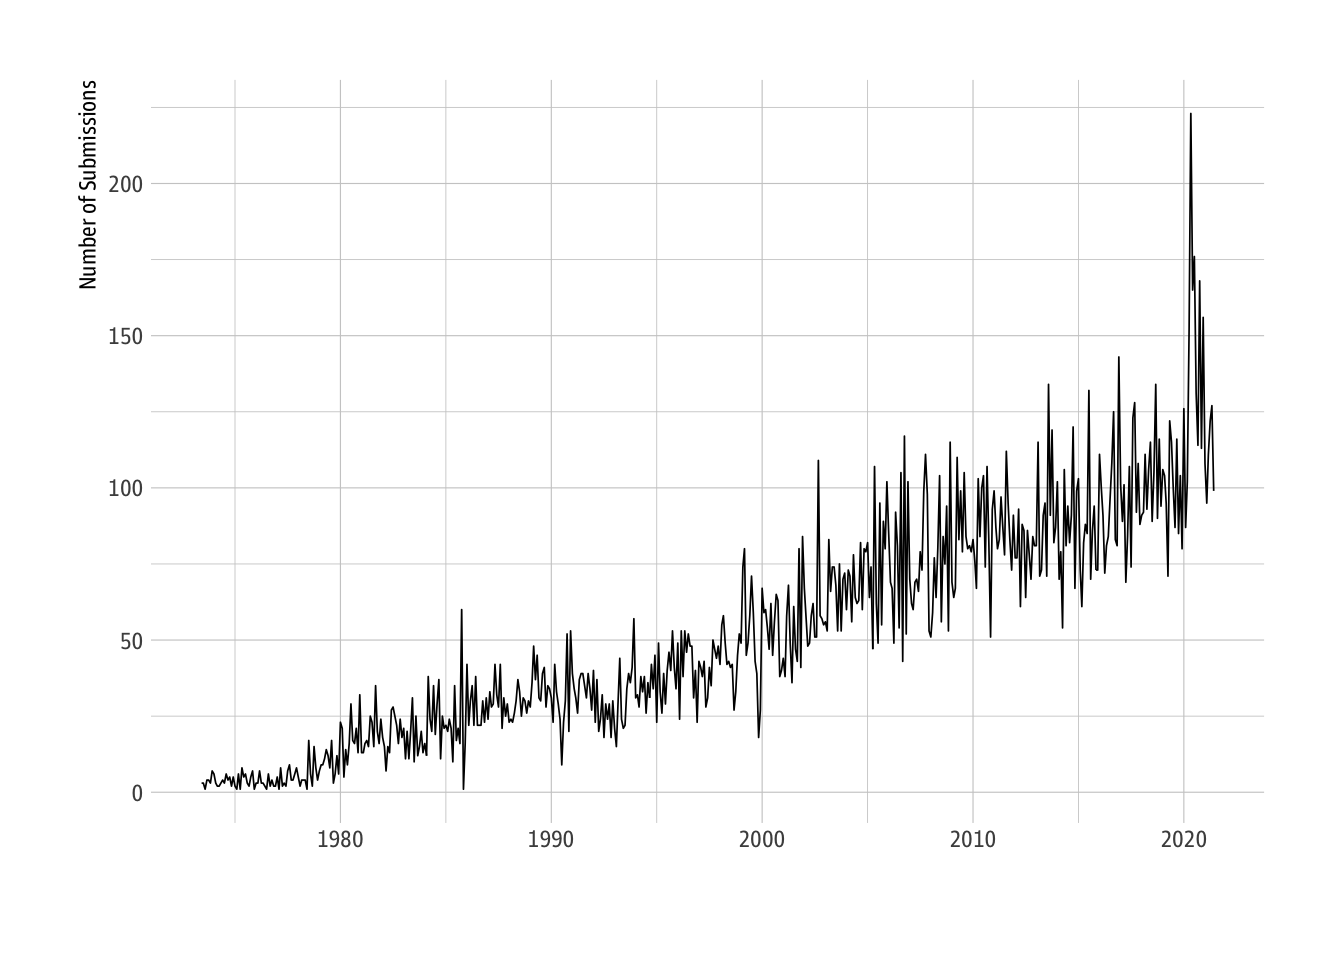
Anecdotally I had heard that many economists were submitting tons of papers to NBER during the Covid-19 pandemic. However, it was not clear to me whether this was a trend or a flash in the pan. The following visualization show that the spike in 2020 was primarily in one month.
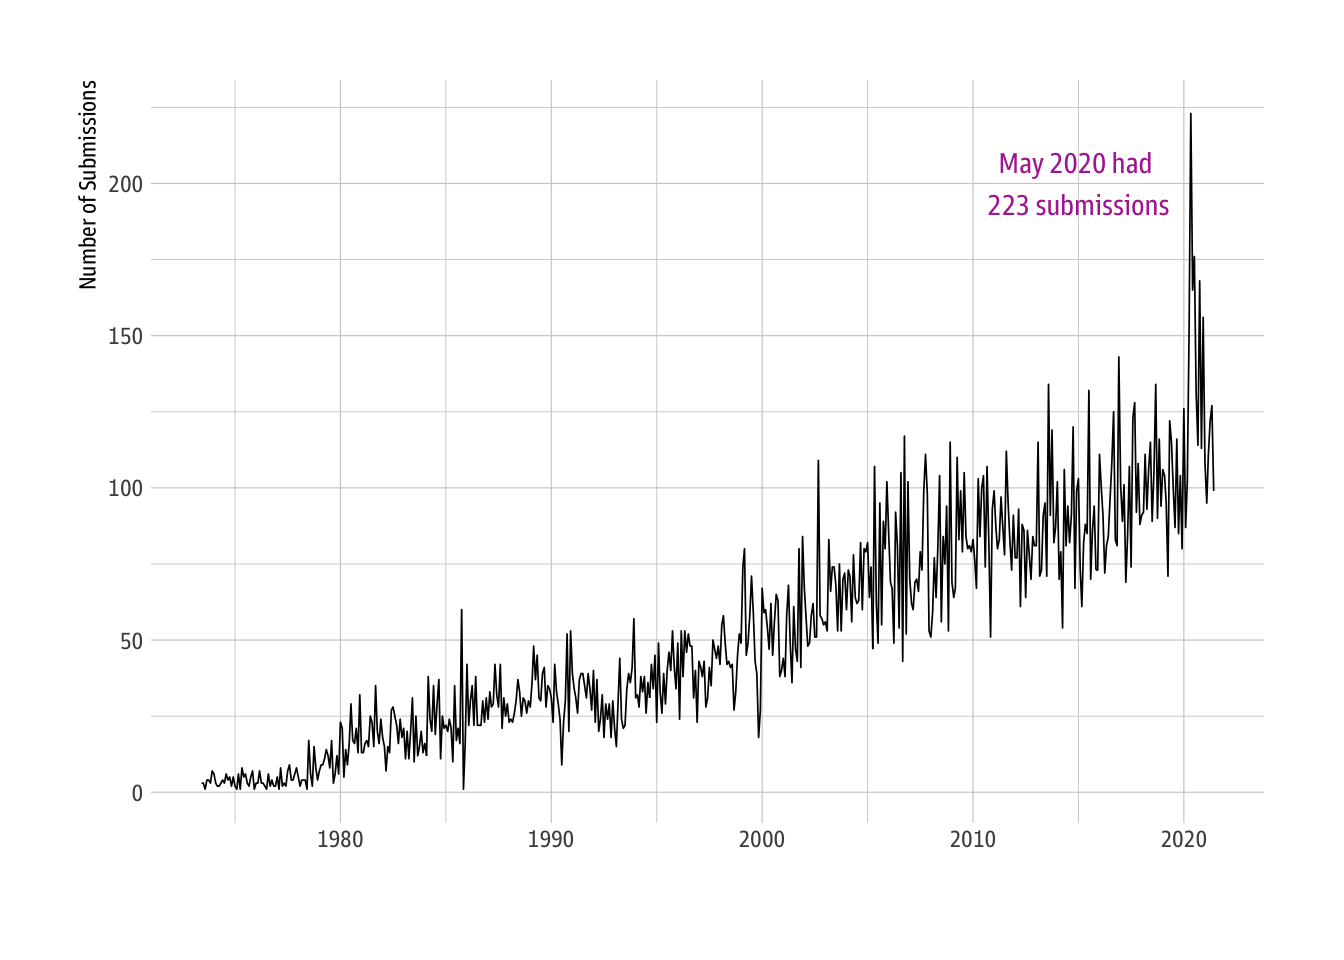
Which month saw the spike? This table shows that it was in May 2020. Top 6 months with highest submissions are in 2020.
| year | month | n |
|---|---|---|
| 2020 | 5 | 223 |
| 2020 | 7 | 176 |
| 2020 | 10 | 168 |
| 2020 | 6 | 165 |
| 2020 | 12 | 156 |
| 2020 | 4 | 152 |
| 2016 | 12 | 143 |
| 2013 | 8 | 134 |
| 2018 | 9 | 134 |
| 2015 | 7 | 132 |
Let’s annotate the earlier plot with the spike in may 2020.
Sub-areas of Economics submitting in May 2020
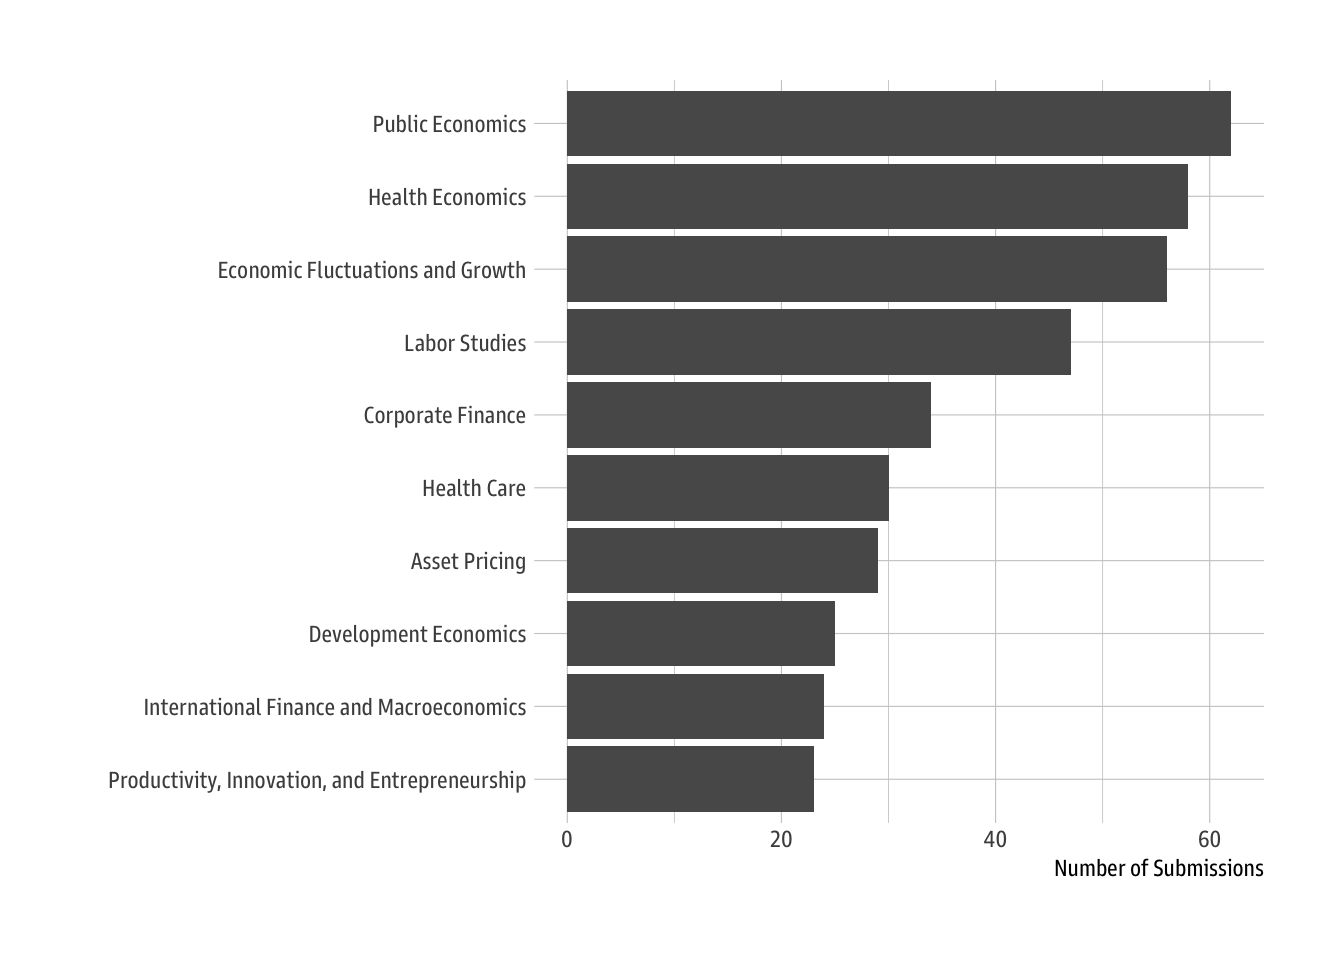
Next, let’s visualize the top subcategories submitting in May 2020. I expected these to be from Heath Care and Heath Economics. But is that the case?
Create a merged data set with papers and programs
Next get the top 10 fields by submissions in May 2020:
Take a look at these fields
| program_desc | n |
|---|---|
| Public Economics | 62 |
| Health Economics | 58 |
| Economic Fluctuations and Growth | 56 |
| Labor Studies | 47 |
| Corporate Finance | 34 |
| Health Care | 30 |
| Asset Pricing | 29 |
| Development Economics | 25 |
| International Finance and Macroeconomics | 24 |
| Productivity, Innovation, and Entrepreneurship | 23 |
Now we are ready to create a bar plot.
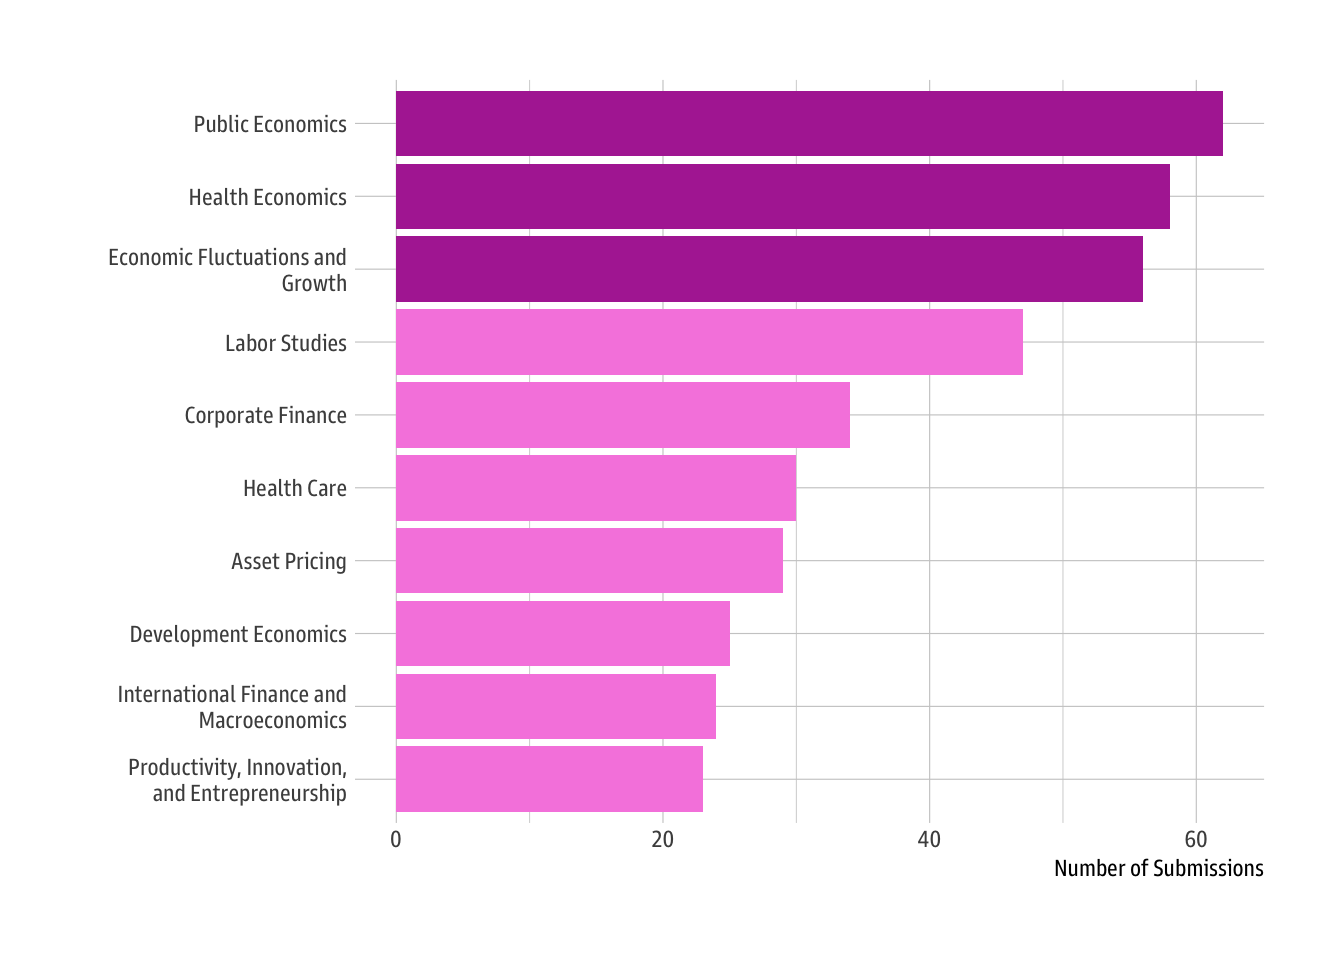
Let’s fill the first 3 bars with a different color. Also, using str_swap function from sringr package (bundled with tidyvere so you don’t have to install it separately) wrap the axis labels.
How does the distribution of the top 10 most submitted program descriptions look like? First, get the top 10 most popular programs of all times.
We can compare individual distributions using facet_wrap. But there is a better way to compare these distributions over time using ggridges package.
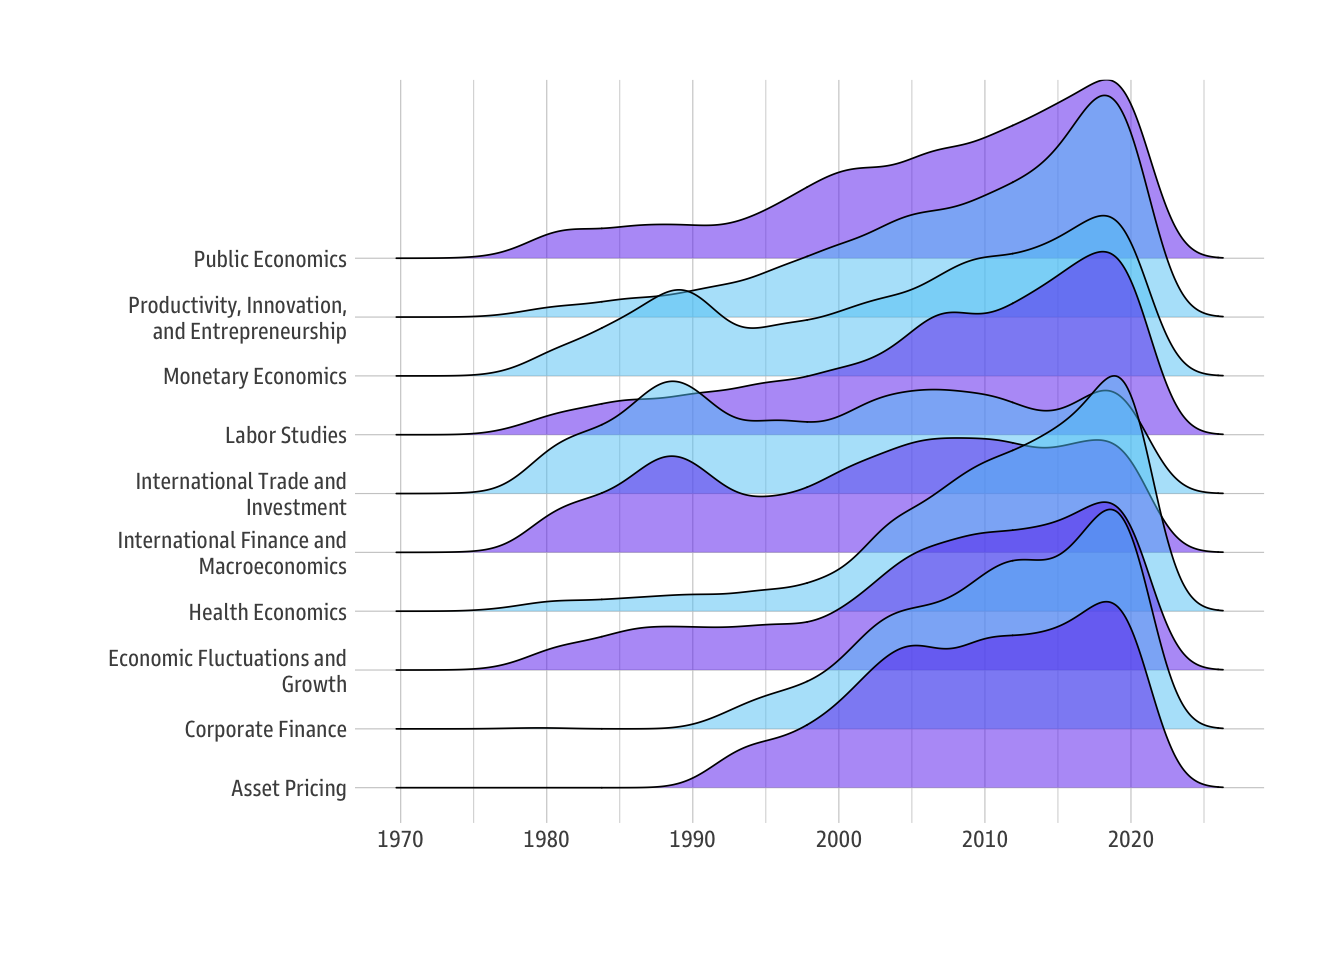
Although almost all the top-10 fields experienced increases in 2020 submissions, International Trade and Finance related submissions were flat. Corporate Finance submissions saw a sharper bump compared to Asset Pricing, which both belong to Finance.